The Northwest Multiple Listing Service (NWMLS) is unique as it is owned and operated by the real estate brokerages it serves. The National Association of Realtors (NAR) is not a member, nor do they have input into the daily operations or policies in any way. NAR membership is optional for individual brokerage members. Fairness, transparency, and ethical business practices guide the conduct of our membersthe
As it is for nearly the whole state, the real estate market has been challenging for both buyers and sellers. Buyers are have to settle for higher interest rates with the hopes that rates will recede, allowing for refinancing in the next few years. They might also have a hard time understanding the level of competition because of the low inventory of available houses. Most sellers will be reinvesting in a home after their sale. They are affected by these two points as well. Adding to the seller’s decision making may be mentally getting out of a sub-4% mortgage on their current home to a 7% mortgage rate on a new loan.
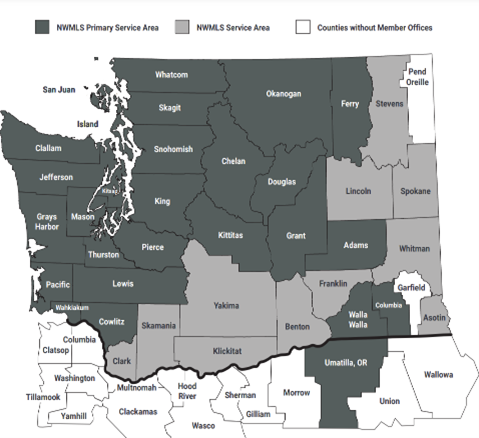
Market Recap: NWMLS covers 26 of the 39 counties in Washington.
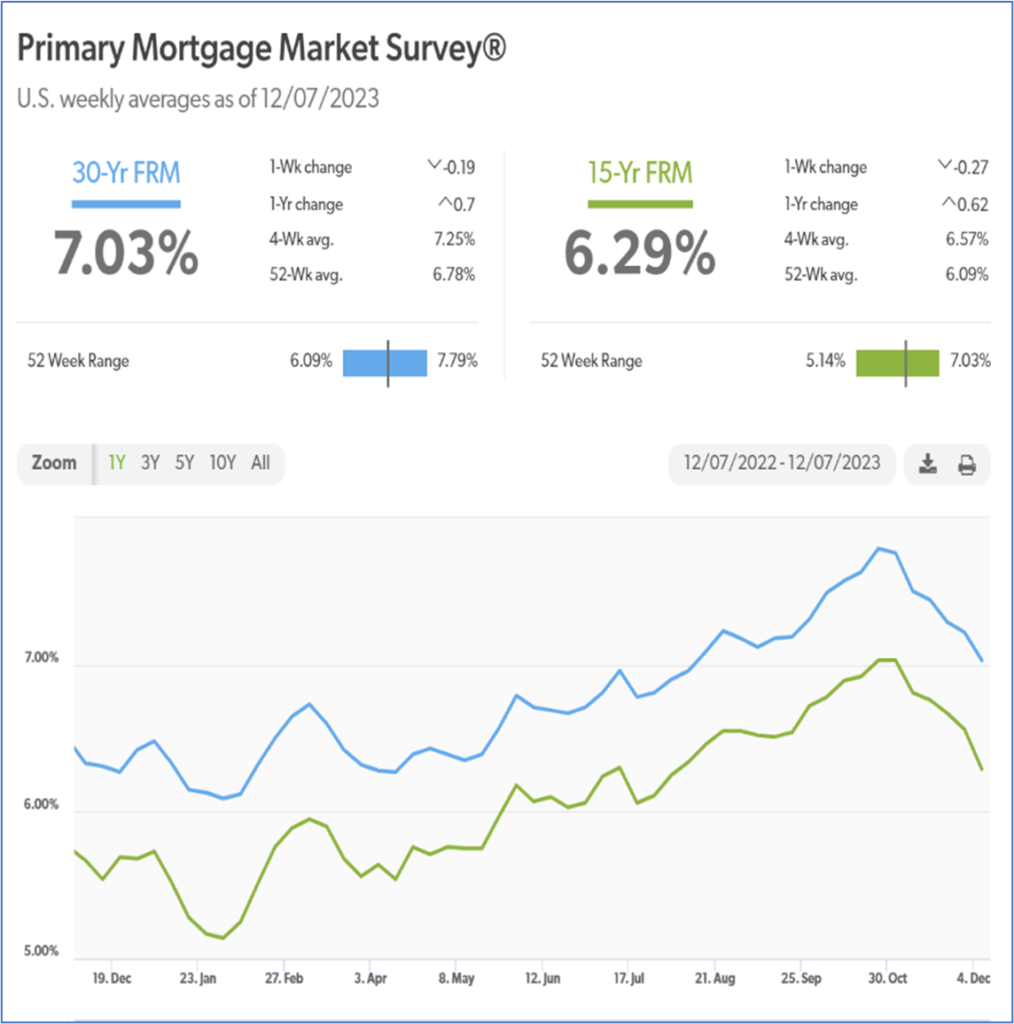
A slight decrease in interest rates has raised cautious optimism – interest rates have fallen to around 7.2%. However, the typical decline in seasonal inventory continues to drive home prices upward, spurring an increase of 4.6% in prices from November 2022.
Even with the decline in mortgage rates to 7.2% buyers are holding buyers back after seeing rates below 5% since 2009.
Homeowners with current loans below 4% are reluctant to make a move with 7% interest rates, low inventory, and rising prices.
Buyers must be prepared to face heated competition for the best homes and increasing prices brought on by low inventory levels.
The Northwest MLS reports a 16% year-over-year drop in closed sales.
19 of 26 counties saw a decrease in the number of homes sold. This comes at no surprise as we are going into winter.
Seven of the counties saw a year-over-year increase, including Grant, Okanogan, Kittitas, Walla Walla, San Juan, Adams, and Ferry counties.
The year-over-year median sales price increased 4.6% in 21 of the 26 counties up to $601,341.
The three counties with the highest median priced homes sold were San Juan ($975,000), King ($799,925) and Snohomish ($703,635).
The three counties with the lowest median priced homes sold were Grant ($327,999), Ferry ($313,750) and Adams ($221,500).
19 out of 26 counties reporting to the Northwest MLS brought a median year-over-year decrease of 17% of active property listings on the market.
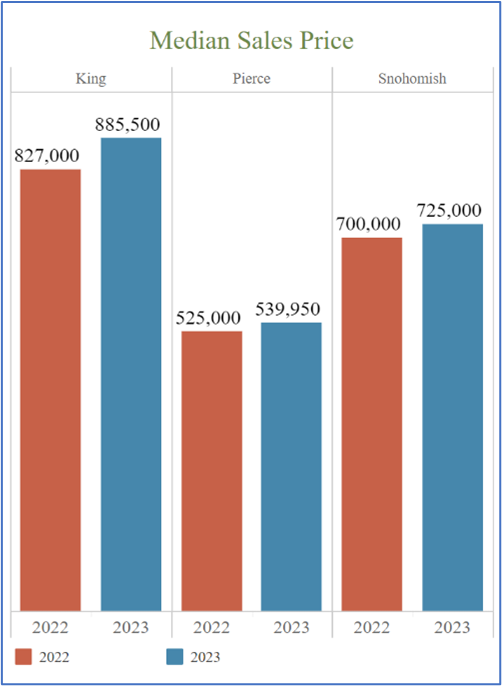
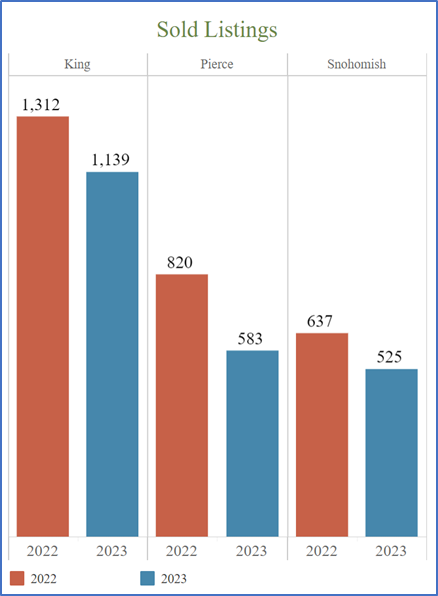
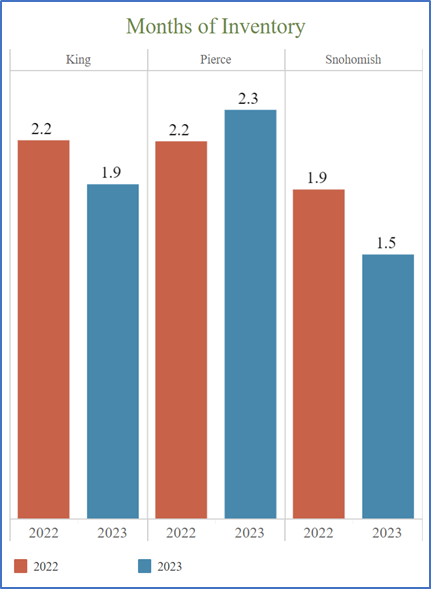
Our Tri-County Area, Pierce-King-Snohomish shows similar results.
Inventory levels are down in 2 of the 3 counties with Pierce showing the biggest lag in sales.
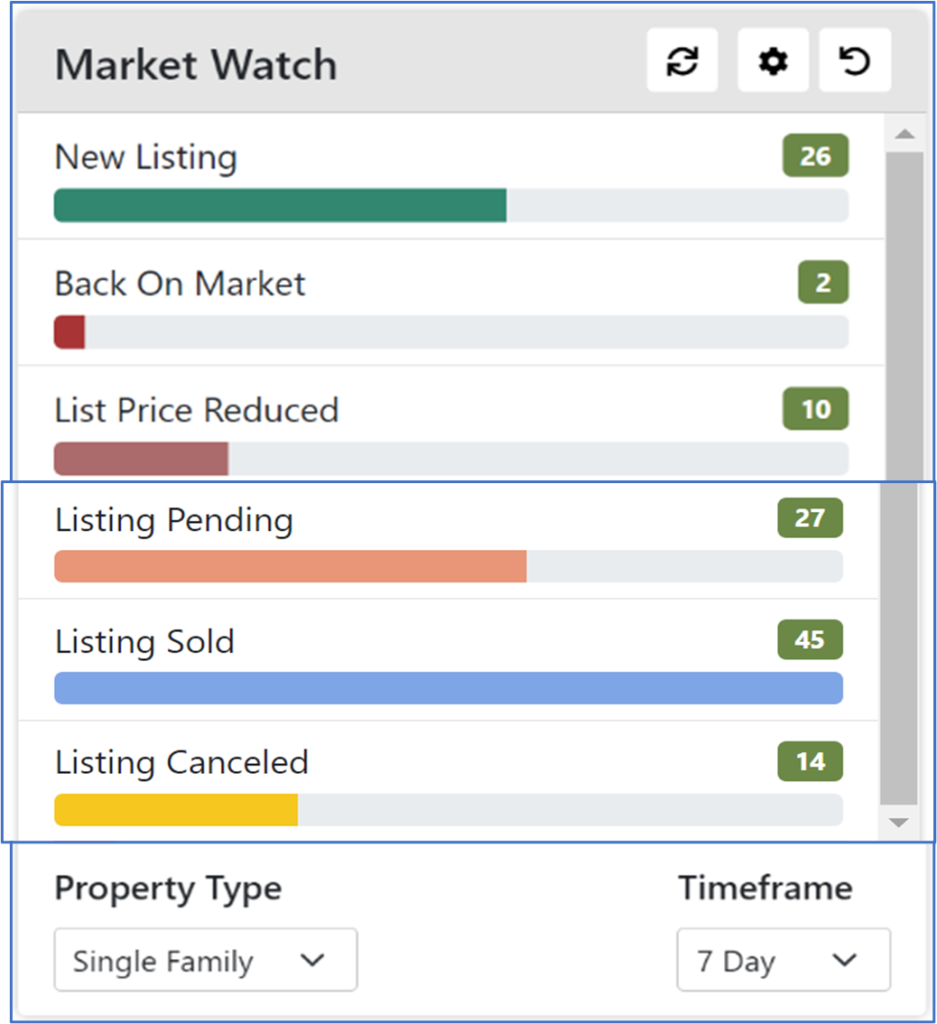
The number of Sold/Closed transactions is down across the board.
SOLD prices have seen an increase in all three counties.
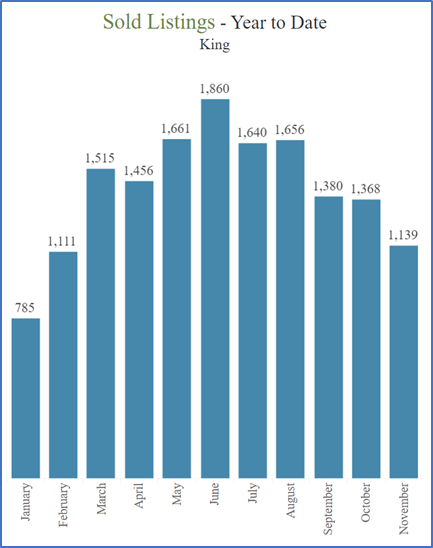
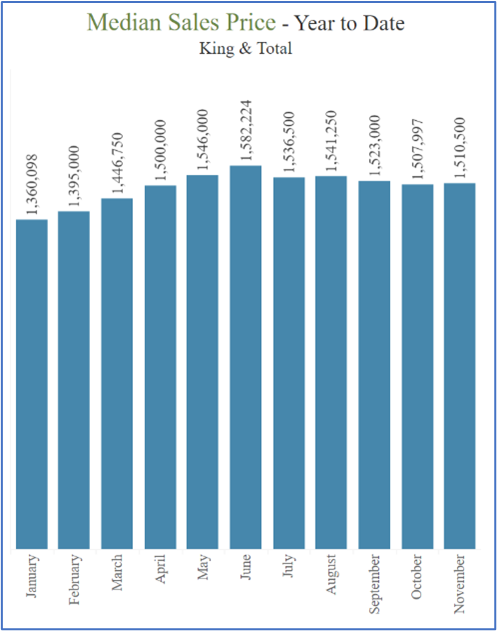
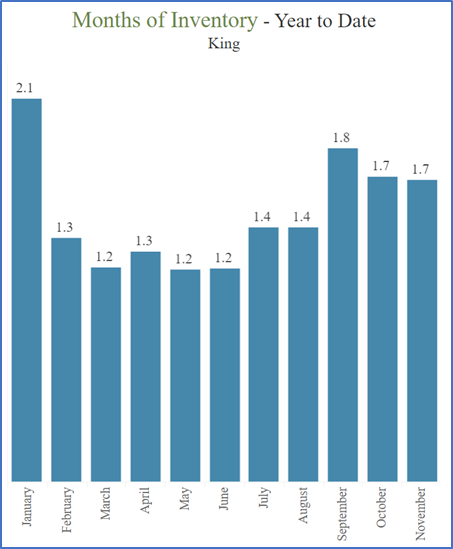
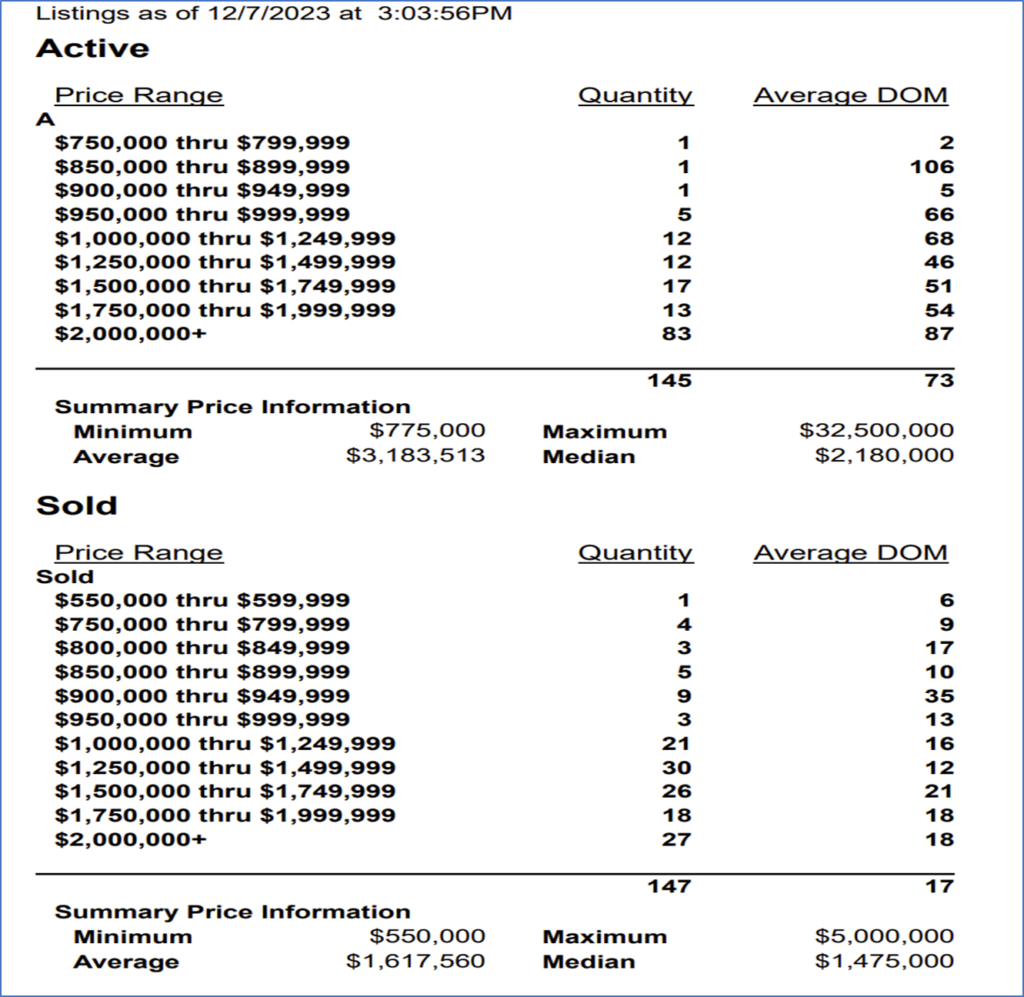
Looking closer to home in King County.
The number of Sold/Closed transactions has seen the typical seasonal drop of nearly 20%.
The Median SOLD prices Are holding steady near $1,500,000.
·Inventory levels remain at “Seller Market” levels which fell below 2 months back in 2015.
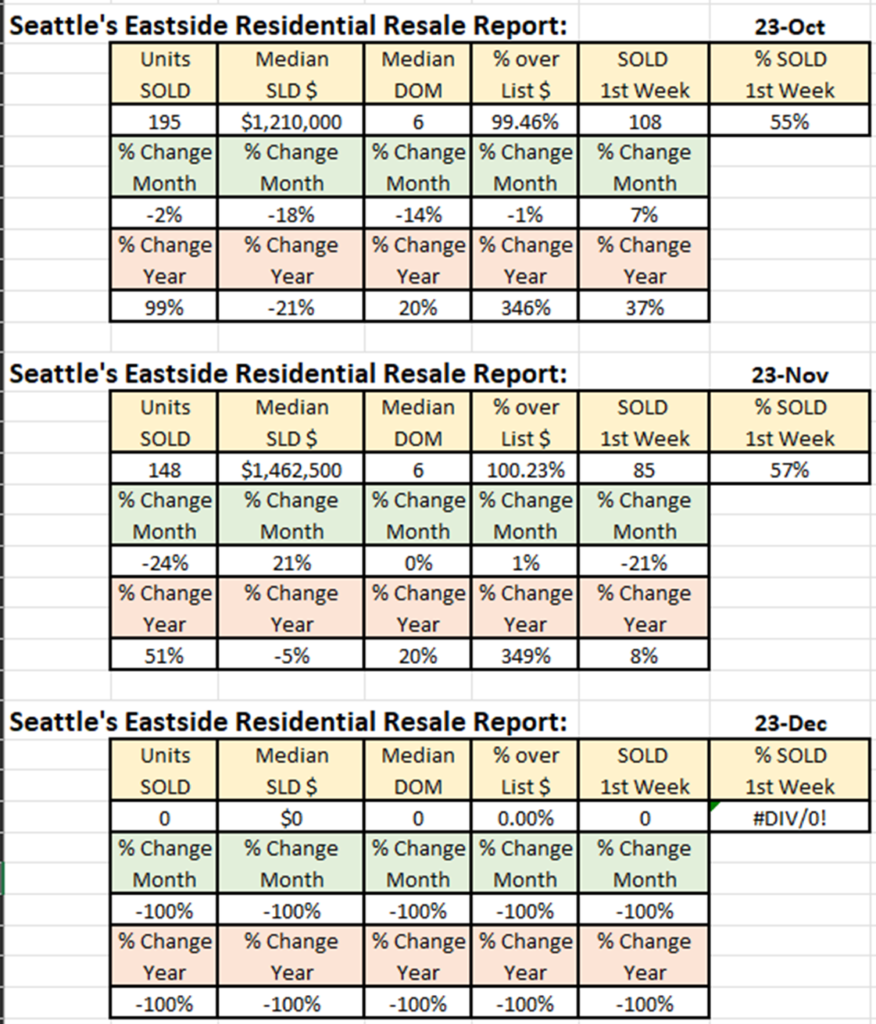
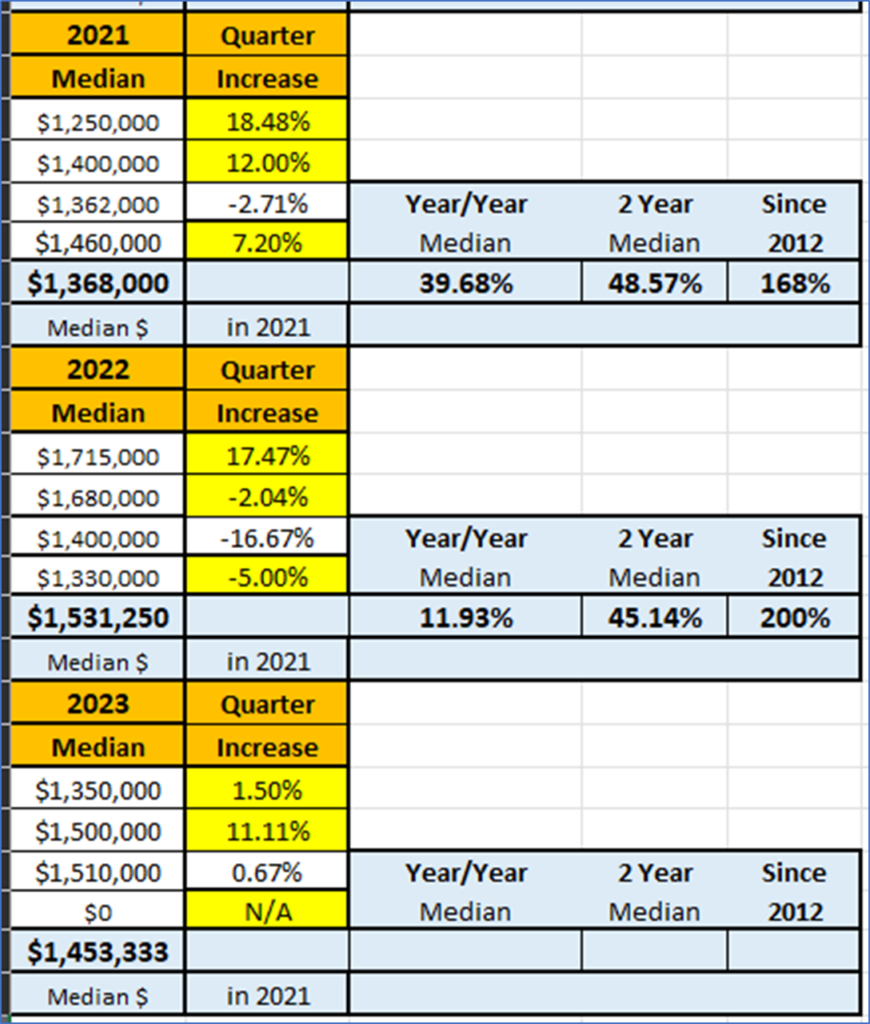
Here on Seattle’s Eastside (Bellevue-Redmond-Kirkland-Issaquah):
The number of SOLD/Closed homes is up 51% across all price points compared to last year.
The median SOLD price across the Eastside is down slightly from last year but up 21% from October.
The median days on the market for a property to be SOLD is 6 days.
Take note that 57% of homes are under contract in the first week. The best homes always sell first and for more money!
To give sellers a little peace of mind, median property values are up 45% in the past 2 years and have doubled since 2012.
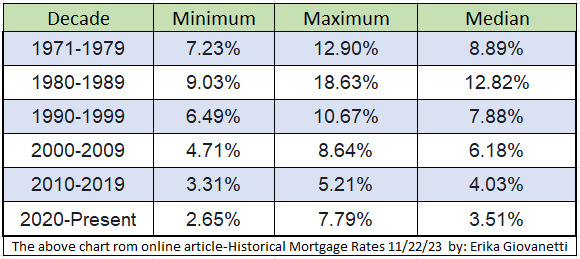
A little information about Mortgage Rates
Mortgage Rate graphic from FreddieMac.
Check REX2020.com for more blog posts and information about the market and strategies for sellers and buyers. This information is valuable and timely for today’s real estate market.
While on my website, check out my proven step-by-step processes for Sellers and Buyers. Both reflect winning strategies from years of experience which adjust to our clients needs and current market conditions. Whether it’s time to sell or buy now, or in the future, Contact me Directly. I will set-up a consultation to explore your options and put a plan of action in place that meets your schedule and expectations.
Not all agents are REALTORS®. brokers that make the commitment are held to a higher standard. Beyond the additional education, we are held accountable to the Code of Ethics. Always ask, “Are you a REALTOR®?”