
There are three drivers to a booming real estate market that affects sellers just as much as it does buyers. First, is the overall economic outlook for the country. Second, the availability of properties and the Affordability Index. The third and seemingly most important to consumers is the mortgage rate.
A 1% rise in the mortgage rate lowers the buyers purchase power by about 10%.
Buyers should always talk with their REALTOR® then sit with a lender to fully understand mortgage payments, programs and available options.
A mortgage rate drop of 1% will increase that buyers ability to purchase by about 10%.
So, will interest rates drop to 4% again?
Some economists are predicting that rates will go back to 5% in the next couple years.
Many more are predicting that the rates will recede to the mid 6% range in the next year.
A few brilliant minds predict a recession, and that rates will continue to rise.
Then there are those that admit that they just don’t know.
Looking Back – The History of Mortgage Rates.
Data from FannieMae Mortgage Rates 1971 to the present. 12/10/2023
Information formatted by Tom Perry – REALTOR® Real Estate Solutions – Realty Executives Brio
April 1971: Beginning of this data 7.33%
Rates continued to rise to October 1981
October 1981: Highest interest rate 18.63%
Nov 1981: Rates drop below 18%
1 mo. 17.65% highest rate this period.
Dec 1981: Rates drop below 17%
9 mo. 17.66% highest rate this period.
Aug 1982: Rates drop below 16%
2 mo. 15.88% highest rate this period.
Oct 1982: Rates drop below 15%
1 mo. 14.96% highest rate this period.
Nov 1982: Rated drop below 14%
4 mo. 13.91% highest rate this period.
Feb 1983: Rates drop below 13%
2 yrs. 9 mo. 14.68% highest rate this period.
Nov 1985: Rates drop below 12%
3 mo. 11.90% highest rate this period.
Jan 1986: Rates drop below 11%
4 mo. 10.89% highest rate this period.
Apr 1986: Rates drop below 10%
5 yrs 5 mo. 11.58% highest rate this period.
Sept 1991: Rates drop below 9%
11 mo. 9.03% highest rate this period.
Aug 1992: Rates drop below 8%
1 year 8.29% highest rate this period.
July 1993: Rate below the 1971 7.21%
23 years to get below 7.33 from 1971.
July 1993: Rate below the 1971 7.33%
It took 23 years to get below 7.33 from 1971.
Aug 1993: Rates drop below 7%
14 yrs 1 mo. 9.25% highest rate this period.
Sept 2002: Rates drop below 6%
8 yrs 4 mo. 6.8% highest rate this period.
Jan 2009: Rates drop below 5%
2 yrs 7 mo. 5.42% highest rate this period.
Oct 2011: Rates drop below 4%
7 yrs 9 mo. 4.94% highest rate this period.
July 2020: Rates drop below 3%
1 yrs 2 mo. Nov 21 the last 2% rate.
Jan 2021: Rate 2.65% Lowest rate ever.
What goes down will go back up!
Nov 2021: Rates passes 3%.
5 mo.
Mar 2022: Rates passes 4%
1 mo.
Apr 2022: Rates passes 5%
6 mo.
Sept 2022: Rates passes 6%
11 mo.
Aug 2023: Rates passes 7%
Oct 2023: Rate above the 1971 7.33%
30 years to go above 7.33% from 1971.
Caused by the mortgage debacle, Covid decisions, and inflation.
How to read this data:
Oct 2011: Rates drop below 4% ………. In October of 2011 the mortgage rates dropped below 4%
7 yrs 9 mo. ……………………………….. 7 years and 9 months later, the rates drop below 3%.
4.94% highest rate this period. …………. During that period the rate fluctuates, and the high was 4.94%
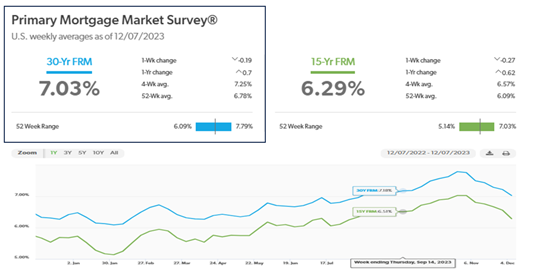
The current mortgage information is most relevant information for today’s borrowers.
A 5 decade look at the history of mortgage rates.
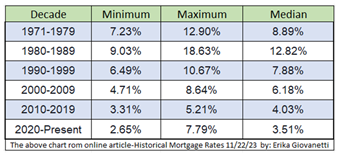
It wasn’t until 2009 that mortgage rates dropped below 5%. Fueled by a recession caused by a mortgage crisis and decisions made during the covid crisis, we saw 5% or lower mortgage rates for 13 years.
Home buyers tend to look at the current rate and forget that mortgage rates can change minute by minute.
Can you really predict future interest rates with any confidence?
Leading economists from the major financial institutions are predicting anything from a decline as low as mid 5% to an increase as high as 9%. They have the education, experience, and the tools that you and I don’t have.
Good Luck with that!
Probably the thing to look at is, do you want or need to buy a home? If rates go down, refinance. If rates go up, you look brilliant. Either way, you bought a home that you love.
Check REX2020.com for more blog posts and information about the market and strategies for sellers and buyers. This information is valuable and timely for today’s real estate market.
While on my website, check out my proven step-by-step processes for Sellers and Buyers. Both reflect winning strategies from years of experience which adjust to our clients needs and current market conditions. Whether it’s time to sell or buy now, or in the future… Contact me Directly.
I will set up a consultation to explore your options and put a plan of action in place that meets your schedule and expectations.
Not all agents are REALTORS®. Agents that make the commitment are held to a higher standard. Beyond the additional education, we are held accountable to the Code of Ethics. Always ask, “Are you a REALTOR®?”